
Monitoring Strategies to Achieve Your ESG Goals

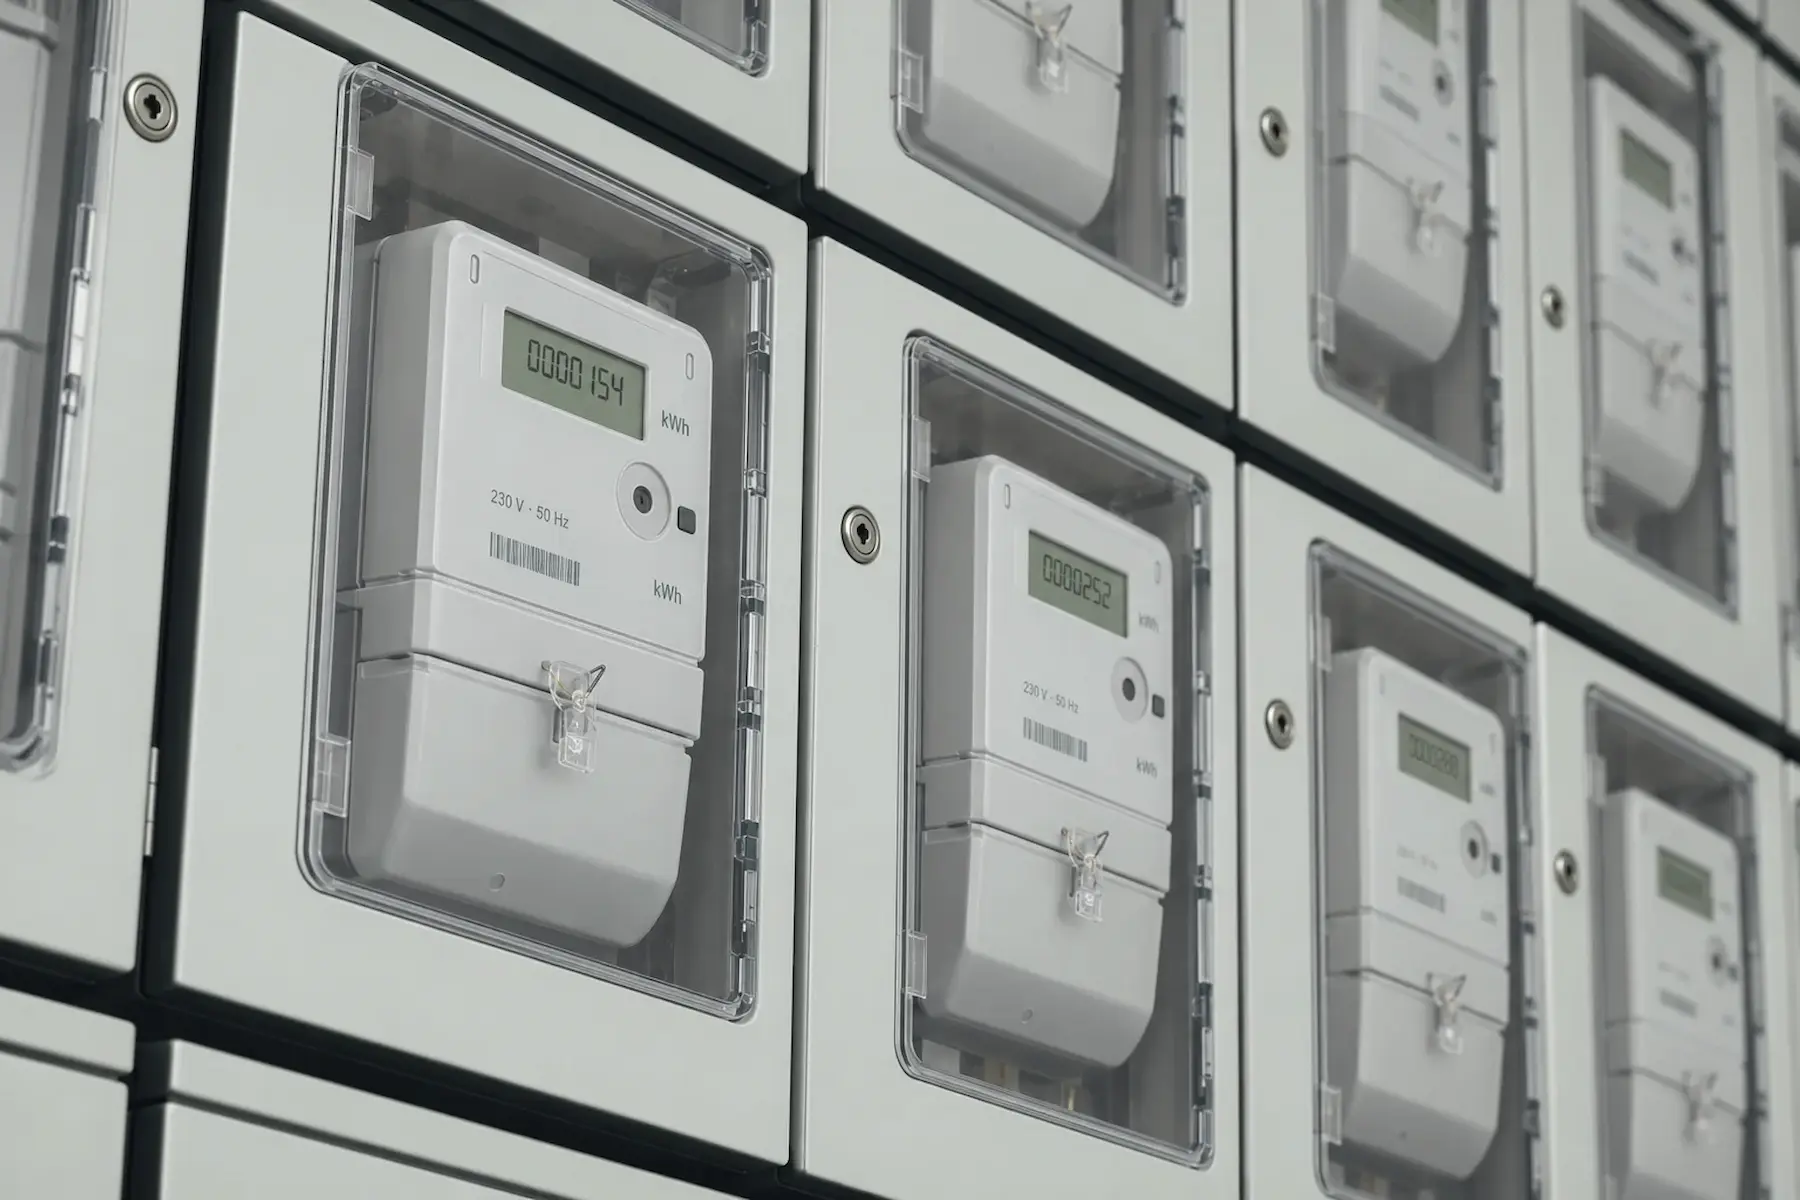
Many organisations make ambitious commitments to cut emissions, improve efficiency or advance decarbonisation. But when it is time to demonstrate progress, they often find that their data are scattered, collected manually and difficult to verify.
Much of the environmental dimension of an ESG strategy lies within buildings and facilities: energy, emissions, water, waste and comfort. Without a monitoring strategy that turns their operation into reliable data, goals remain statements of intent that are hard to substantiate for an auditor, investor or customer.
This guide covers what to measure, which sustainability indicators you can track across your facilities, the monitoring strategies that support them, how to ensure data quality and how to use the results in ESG reporting.
What should you measure to track progress towards your ESG goals?
Start with a materiality assessment: identify which ESG matters are relevant to your business and its stakeholders. EU rules also use the concept of double materiality, which considers both the company’s impact on people and the environment and how sustainability matters affect the business. Defining material topics before installing sensors helps focus measurement on the issues that inform decisions.
Once you know what matters, translate each goal into three elements:
- A starting position: where you are today.
- An indicator that shows progress.
- A quantified target with a deadline.
This familiar management approach separates a stated commitment from actual performance.
It is important to define the scope. ESG covers environmental (E), social (S) and governance (G) issues. At building or facility level, direct monitoring is concentrated on environmental performance, with energy underpinning much of it. Consumption affects the carbon footprint, operating costs and the pace of building decarbonisation. Relevant social measures include indoor air quality and occupant comfort, while governance is reflected in the traceability and control of the data itself.
The key is to measure continuously rather than occasionally. An annual snapshot is not enough to manage performance. Timely action depends on up-to-date energy data that remain comparable over time.
Which sustainability indicators can you monitor in your facilities?
These are common indicators that can be monitored at building or facility level, together with their ESG dimension and typical data sources.
| Indicator | What it measures | Unit | ESG | Data source |
| Energy consumption | Total energy by source, end use and floor area | kWh, kWh/m² | E | Meters, data loggers, EMOS |
| Carbon footprint | Scope 1, 2 and 3 GHG emissions associated with consumption | tCO₂e | E | Consumption data and emissions factors |
| Energy efficiency | Energy use relative to activity or floor area | kWh/unit, kWh/m² | E | Performance indicators and baselines |
| Renewable energy and self-consumption | Share of renewable or self-generated energy | % | E | Inverters and generation meters |
| Water consumption | Volume used and deviations | m³ | E | Meters and IoT sensors |
| Indoor air quality and comfort | CO₂, temperature, humidity and particles | ppm, °C, % RH, µg/m³ | S | Indoor environmental quality sensors |
Energy consumption
Energy consumption is the foundation of an ESG strategy for facilities. A single total is not enough: to take action, break it down by energy source (electricity, gas and fuels), end use (heating and cooling, lighting and processes), and floor area or activity. This detail helps locate excess consumption and prioritise measures. For structured energy management, ISO 50001 provides a framework for baselines and energy performance indicators.
Carbon footprint
Greenhouse gas emissions are calculated in large part using energy consumption and the relevant emissions factors, following frameworks such as the GHG Protocol or ISO 14064. Scope 1 covers direct emissions, such as on-site combustion; Scope 2 covers emissions associated with purchased electricity; and Scope 3 covers other indirect value-chain emissions. Robust energy monitoring is a prerequisite for a credible ESG carbon footprint: weak consumption data produce a weak emissions calculation.
Energy efficiency
Absolute energy consumption alone is not enough because it depends on activity. Energy performance can be expressed as energy used per reference unit, such as floor area, output, degree days or occupancy. This indicator supports consistent comparisons across periods and buildings and shows whether an improvement measure works. For more detail, see our guide to what energy efficiency means.
Renewable energy and self-consumption
The share of energy from renewable sources, whether generated on site or purchased, is increasingly requested in sustainability reports. Monitoring on-site solar generation and how much of it is used by the facility demonstrates actual progress, rather than installed capacity alone.
Water and resource use
Although energy often receives most attention, water is important in many facilities. Connected meters can reveal leaks and deviations that might otherwise go unnoticed until the bill arrives.
Indoor air quality and comfort
This indicator connects the environmental and social dimensions. Measuring indoor CO₂, temperature, humidity and particulate matter helps maintain healthy environments while managing energy efficiently, and provides concrete data for the social dimension of reporting. We explore this in our article on office air quality and predictive maintenance.
What makes ESG monitoring difficult?
Before designing a strategy, it helps to recognise the barriers that commonly hold organisations back.
- Fragmented data. Information is scattered across meters, spreadsheets and systems that do not communicate, preventing an overall view. Manual collection adds delays, gaps and errors that undermine reliable tracking.
- Lack of standardisation. Without consistent measurement rules and units, data from different facilities cannot be compared or consolidated, and every report becomes an exercise in reconstruction. Unclear responsibility for capturing and checking data compounds the problem.
- Greenwashing risk. Publishing figures that cannot be verified damages credibility and can expose a company to scrutiny from regulators, investors and customers. The answer is a structured monitoring strategy, rather than more manual effort.
Strategies for monitoring progress towards your ESG goals
Choosing the indicators is the first step. The second is deciding how to collect and centralise them and turn the results into decisions. The following strategies support reliable tracking.
Centralise data on one platform
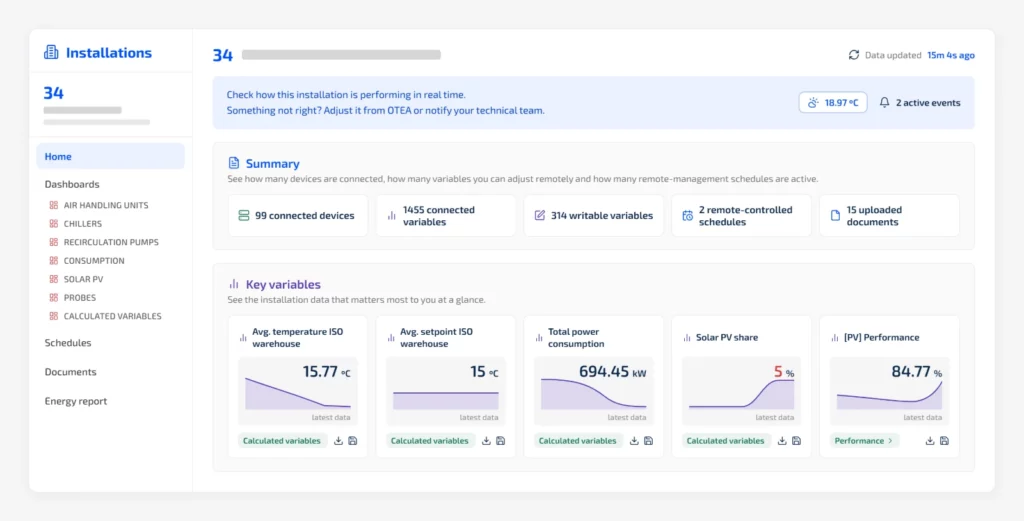
The most common obstacle is not a lack of data but the fact that they are scattered. Centralising collection in an Energy Management and Optimization System (EMOS) makes it possible to bring different sources together, validate them and present comparable results across facilities. This provides the foundation for the ESG strategy.
Measure continuously and in real time
Real-time monitoring reveals deviations while there is still time to correct them, rather than three months later. Continuous measurement turns data into a tool for active energy management instead of a historical record.
Automate data collection with IoT and data loggers
Manual collection introduces errors, gaps and delays. Connected sensors and data loggers provide a continuous, consistent flow of data. IoT for energy management makes it possible to scale monitoring across dozens of measurement points and facilities without relying on manual readings.
Establish baselines and comparable indicators
Without a baseline, progress cannot be demonstrated. Every indicator needs a documented starting point and, where appropriate, normalisation to make comparisons across periods and buildings meaningful, for example by floor area, degree days or activity level. Only then can a reduction in consumption be distinguished from a milder winter or lower occupancy.
Connect monitoring with management and optimisation
Measurement is necessary but not sufficient. A mature ESG strategy links monitoring to action: analysing deviations, adjusting setpoints, scheduling equipment and verifying the effect of each measure. This connection between data and decisions distinguishes an optimisation platform from a dashboard. It can also support incentive schemes such as Spain’s Energy Savings Certificates (CAEs), which require savings to be evidenced with data.
How can you ensure the quality and traceability of ESG data?
An ESG report is only as reliable as the data behind it. In an external verification, the question is not simply how much you have reduced, but whether you can demonstrate it.
Full traceability means being able to follow every reported figure back to the sensor or meter that produced it, without unexplained gaps or manual adjustments. Data validation adds automated checks for anomalous readings, missing values and impossible figures before they distort the analysis.
Standardisation ensures that facilities use consistent criteria and units, which is essential for comparison and consolidation. Coverage and time resolution also affect reliability: continuous hourly data offer a firmer basis than occasional manual readings.
All of this requires clear data governance: who collects the data, who validates them and who is accountable for their quality. Without assigned responsibilities, even a good measurement system develops gaps. Traceability is also a defence against greenwashing: when every figure can be checked, sustainability claims rest on documented evidence.
When a platform centralises collection and documentation, the organisation can approach an audit with the evidence already in place rather than rebuilding it under pressure each year.
How do you use monitored data in ESG reporting?
Monitored data feed sustainability reporting frameworks. The European Sustainability Reporting Standards (ESRS), used under the Corporate Sustainability Reporting Directive (CSRD), require information on climate, energy and emissions that depends on reliable measurement. International frameworks include the GHG Protocol for emissions accounting by scope and GRI for sustainability reporting.
The regulatory context changed in 2026. The Omnibus simplification package substantially narrowed the mandatory scope of the CSRD: estimates put the number of companies required to report at roughly 5,000, down from around 50,000. The revised ESRS reduce mandatory datapoints by more than 60%. As a general rule, the CSRD now covers companies with more than 1,000 employees and net turnover above €450 million. The revised ESRS are scheduled to apply to financial years beginning on or after 1 January 2027.
This does not mean reporting no longer matters. Many companies outside the mandatory scope will still receive requests for sustainability data from investors, banks and major customers, and some will report voluntarily using simplified standards. In either case, the underlying need is the same: verifiable information supported by traceable energy data.
Done well, monitoring makes reporting a process of extracting and consolidating data rather than an annual scramble to gather it manually. This turns ESG compliance into an ongoing capability.
Turn facility data into sustainability decisions
Monitoring underpins the whole process: without reliable data there are no sound indicators; without indicators there is no meaningful tracking; and without tracking there is no progress to demonstrate.
At EcoMT, we designed OTEA as an EMOS platform that brings together the capabilities needed to sustain that progress:
- Continuously monitor and standardise data from your facilities.
- Manage the data to detect deviations.
- Prioritise measures.
- Optimise operations so improvements are sustained over time.
The result is more than another dashboard. It is a foundation of data, control and traceability that makes ESG goals measurable, verifiable and sustainable over time.




You deserve a facility management system that works with you
Request a free demo and discover how other maintenance, sustainability, and energy efficiency teams are achieving real results. No unnecessary complexity. Just a clear roadmap designed to scale with you.



