
How Big Data transforms infrastructure management and operational efficiency

Infrastructure management has taken a 180 degree turn thanks to digitalization. Today, sensors and connected systems generate a massive amount of data that, when used correctly, allows us to make much more accurate and efficient decisions. Big Data goes beyond the simple accumulation of information; It is the key component that helps our infrastructure become intelligent systems, capable of preventing problems and even operating almost autonomously.
To give you an idea of what we are talking about, companies that already apply it are seeing a reduction in maintenance costs of between 25 and 30%. But not only that, they also minimize unplanned downtime by 70-75% and manage to extend the useful life of their equipment by up to 40%. These numbers make it quite clear that analyzing data is not a simple improvement, but can completely change the way a company organizes its work.
So, what exactly is Big Data in infrastructure management?
Put simply, Big Data in infrastructure management combines technologies to capture, process and analyze massive volumes of information. The ultimate goal is for all this data to become practical knowledge that helps us act. In this way, facilities cease to be static elements and become dynamic systems that learn, adapt and optimize themselves.
From isolated data to connected system
Before, the data generated by an infrastructure was stored in systems that did not talk to each other. The great qualitative leap is that now we can connect everything. Imagine for a moment that an energy management platform (an EMS) simultaneously receives data from temperature sensors, consumption meters, air quality systems and air conditioning equipment. Suddenly, you have a complete picture of what’s happening and you can make decisions with all the information on the table, almost instantly.
Sources of information and company systems
And all this information, where does it come from? Well, from a wide variety of sources:
- On the one hand, you have IoT sensors: small devices that measure temperature, humidity, pressure, vibrations or energy consumption, and they do so with sampling rates of up to milliseconds.
- Then there are the BMS (Building Management Systems), which are the building management platforms that centralize the control of heating and cooling, lighting and security.
- We also have SCADA platforms, which supervise delicate industrial processes and allow remote management of equipment that is in different locations.
- In manufacturing environments, MES systems (Manufacturing Execution Systems) provide critical data from the production process: manufacturing orders, material traceability, quality control and equipment performance in real time.
- And finally, the Integration APIs, which are nothing more than connectors to bring incoming data flows from other external systems to a single platform where everything is analyzed together.
An important detail: for all these systems to work in a coordinated manner, it is advisable to opt for open architectures instead of closed proprietary solutions. This facilitates integration between different manufacturers, avoids being stuck with a single supplier and allows systems to be scaled or adapted as needs evolve without depending on incompatible technologies.
From analyzing the past to predicting the future
Okay, now we know where the data comes from. But what is interesting about all this? Precisely, see how the way of analyzing them has changed.
At first, it only served us to look back and understand “what happened?” (known as descriptive analytics). Shortly after, we go on to find out “why did it happen?”“. The real change comes now, when technology allows us to anticipate and know “what is going to happen?” (the predictive part) and even recommends us “what should we do?” (the prescriptive part).
For example, there are already algorithms that learn from historical data and are capable of predicting a breakdown with an accuracy of over 90%. If a machine’s motor starts to vibrate a little more than normal for three days in a row, the system can identify that this usually results in a bearing failure and, therefore, schedule a service before the breakdown occurs.
What is Big Data used for in infrastructure management?
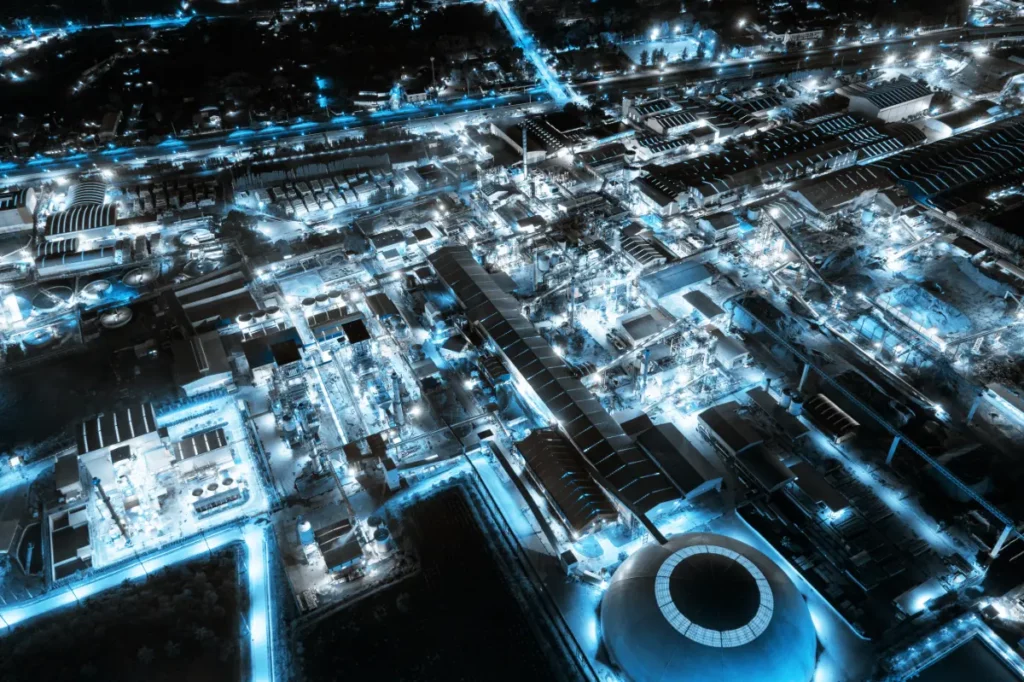
The practical applications of Big Data change everything in infrastructure management, from how we monitor equipment to how we save energy:
- Industrial sensing: Have a network of sensors monitoring key equipment day and night. If they detect something abnormal, they send a warning before the problem gets worse.
- Predictive maintenance: Instead of checking everything “just in case,” algorithms tell you which equipment needs attention and when. This can reduce maintenance costs by 18-25% and downtime by up to 50%.
- Intelligent energy optimization: Management systems automatically adjust consumption depending on whether there are people in the building, the weather outside or the price of electricity at any given time.
- Air quality management: Environmental parameters are continuously monitored and ventilation is adjusted so that it is always at optimal levels.
- Scalable infrastructure for AI: Cloud architectures that dynamically adapt to the computational demands of machine learning algorithms.
- Multi-layer optimization systems: Smart platforms that balance performance, sustainability and operating costs through multi-objective optimization algorithms.
In short, it is about moving from a reactive model, which solves problems, to a proactive one that directly avoids them.
From control panels to operational intelligence
This is where you really notice the difference. It’s no longer just about having a panel full of graphs that tell you what happened yesterday. Now, the information is used so that the system itself acts. It means stopping being a spectator so that the technology works for you.
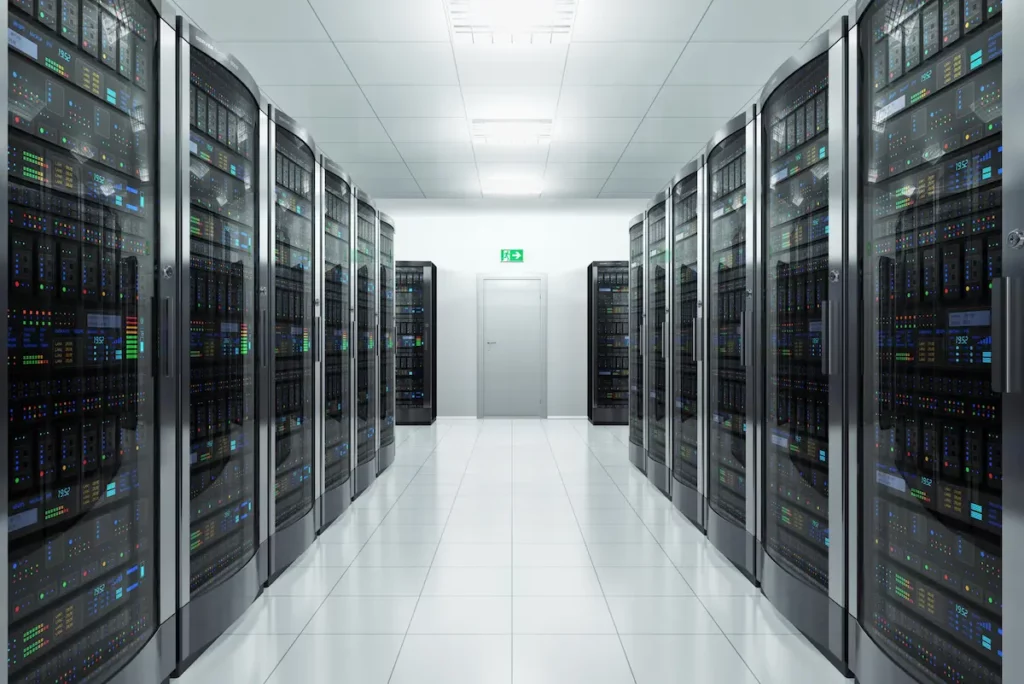
Think of a modern data center. If the temperature in a server room starts to slowly rise, a DCIM (Data Center Infrastructure Management) system integrated with Big Data doesn’t wait for a technician to see it on a screen. It acts directly: adjusts the speed of the CRAC s (precision air conditioning units), redistributes thermal loads, optimizes airflow between cold and hot aisles and, in addition, sends a notification for the cooling system to be checked. All this while monitoring the PUE (Power Usage Effectiveness) to maintain the energy efficiency of the data center at optimal levels.
Thanks to this autonomous operational management, technical teams can focus on higher-value tasks, while automated systems ensure that everything runs smoothly. Here tools come into play that allow the creation of personalized graphs and dashboards to visualize real-time data from the entire critical infrastructure and act on it quickly.
The benefits of Big Data for efficiency
When these solutions are applied well, the benefits are noticeable, and a lot:
- There is a significant operating cost reduction, between 25 and 30% in maintenance and 18-25% in general expenses.
- Efficiency improves greatly: it is possible to reduce unplanned downtime between 30 and 50%, allowing the facilities to operate with a very high availability, above 99%.
- It is possible to extend the useful life of the assets by between 20 and 40%, making the investment made much more profitable.
- The impact on sustainability is also measurable. Energy consumption can be reduced by between 7 and 12%, with the reduction in CO₂ emissions that this entails.
- Decisions are made with reliable, real-time data, improving accuracy by more than 85%.
- The cloud infrastructure adapts itself to what you need, optimizing resources and costs.
The difficulties of launching Big Data projects
Obviously, not everything is so simple. Starting a Big Data project in infrastructure has its complications and must be planned well:
- Manage the amount of data: Modern facilities generate terabytes of information daily, and systems are needed that can store and process it without breaking down.
- Scalability: Systems must be able to grow at the same pace as data without losing efficiency. Here what we mentioned before becomes important again: having open architectures and modular systems that allow capacity to be expanded by adding more resources (horizontal scaling) without depending on a single manufacturer or being limited by closed proprietary technologies.
- Integration with old systems: Many times, older equipment is not designed to connect. Modernizing them takes time and money.
- Qualified personnel: For this to work, profiles such as data scientists, IoT experts and technicians with analysis knowledge are needed.
- Security: By connecting all systems, you open new doors to possible cyberattacks, so security has to be a top priority.
- The initial investment: This is a point that should be clarified. Implementing a complete infrastructure with Big Data can require between €50,000 and €500,000 depending on the size of the project. But the key is this: most modern facilities already need control and monitoring systems (BMS, SCADA, sensors) regardless of whether they are going to do Big Data or not.
Therefore, the real differential cost of adding advanced analytical capabilities on that basis is much lower, normally between €15,000 and €60,000 for the analytics and predictive algorithms layer. Furthermore, betting on open architectures reduces investment even further. ROI usually occurs between one and two years.
And how is all this unified? With a multisite platform
How can this entire complex data network be managed? The key is to adopt multisite solutions that centralize everything.
The idea is to bring data from all facilities to a single place in the cloud. In this way, information silos are broken and you can compare, for example, the performance of one site with another in a very simple way. Cloud architecture allows companies with multiple workplaces to manage everything from a single point, with data always updated.
These integrated systems use algorithms to generate alerts that anticipate problems, sometimes weeks in advance. They analyze everything – historical data, weather forecasts, the behavior of the equipment – and calculate the probability of failure with an accuracy that exceeds 90%. In addition, these alerts are organized by priority, so the team knows what is most urgent and false alarms are reduced by more than 75%. In the end, you have visibility and control of everything from a single platform. Energy, maintenance, air quality, security… all in one place. Operators can view leading indicators, schedule tasks and optimize resources from a single interface, which can also be customized so each person sees exactly what they need.
Toward more efficient and forward-looking infrastructure management

In short, the combination of Big Data, artificial intelligence and cloud architecture is completely transforming infrastructure management. It is not just a technological advance; It is a new operating model, focused on making operations more autonomous and more optimized.
Organizations that rely on these technologies are seeing measurable improvements: 30 to 50% less downtime, up to 40% longer equipment lifespan and 25-30% savings in operating costs. These are data that show that investing in data analysis pays off.
The future of infrastructure management involves systems that not only collect data, but use it to act and keep everything working in the best possible way. Platforms like OTEA, powered by conversational intelligence assistants like Nerea, are already making this a reality, turning each data point into an action that improves performance, saves costs and contributes to sustainability.
The cost reduction and operational efficiency data mentioned in this article are supported by industry benchmark studies:
- McKinsey & Company: “Digitally enabled reliability: Beyond predictive maintenance”. Analysis on the impact of predictive maintenance and Big Data on industrial infrastructure that documents cost reductions of 18-25% and improvements in availability of 5-15%.
- PwC & Mainnovation: “Predictive Maintenance 4.0: Predict the unpredictable”. Study of 268 European companies that confirms the quantifiable benefits of predictive analysis in industrial operations.
- Deloitte: “Using AI in predictive maintenance to forecast the future” . Report on the use of artificial intelligence to optimize predictive maintenance, documenting 30-50% reductions during downtime and 20-40% improvements in operational efficiency in industrial environments.
- MarketsandMarkets: “Predictive Maintenance Market Report (2024-2029)” . Market study projecting global predictive maintenance growth from $10.6 billion in 2024 to $47.8 billion in 2029 (CAGR 35.1%), highlighting the role of AI, IoT and predictive analytics in reducing failures and maintenance costs.

Recommended for you


You deserve a facility management system that works with you
Request a free demo and discover how other maintenance, sustainability, and energy efficiency teams are achieving real results. No unnecessary complexity. Just a clear roadmap designed to scale with you.




