
Compare the consumption of your electricity meters quickly with BEn
OTEA Ben is an energy performance comparator designed to help you detect anomalies and consumption peaks faster. If your business requires a large number of facilities, use OTEA’s API to connect, analyze, compare and classify all your electricity supplies with BEn without installing a single piece of equipment.
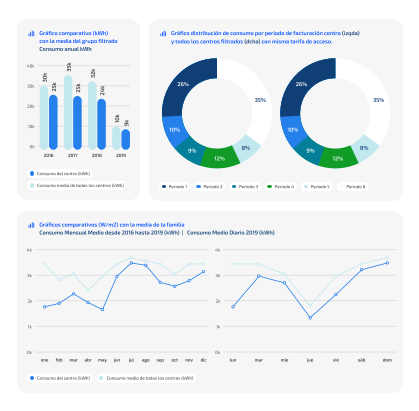
Detect anomalies and save, faster
An energy performance comparator that connects all your supplies via API, without installing equipment, so you can compare and classify in minutes.

Compare consumption faster
Analyzing energy consumption data is the first step to planning and prioritizing energy efficiency actions. OTEA BEn helps you identify inefficient consumption patterns so you can start saving.

An easy, intuitive interface
Create families following criteria such as area or location and compare energy data in minutes directly in the BEn module, without needing to program or write a single line of code.

We adapt to your use case
Compare supplies using the indicators that best fit your business: Energy (kWh), Average night-time consumption (W/m²), Energy cost (€/m²) or Peak power per m² (W/m²). If you need it, we create custom indicators for you.

No limits and no equipment to install
The supplies’ consumption data connects to OTEA through the APIs provided by the electricity distributors, so it doesn’t matter how many supplies you have contracted or which electricity retailer you use.
From connecting to saving, step by step
Connect electricity supplies
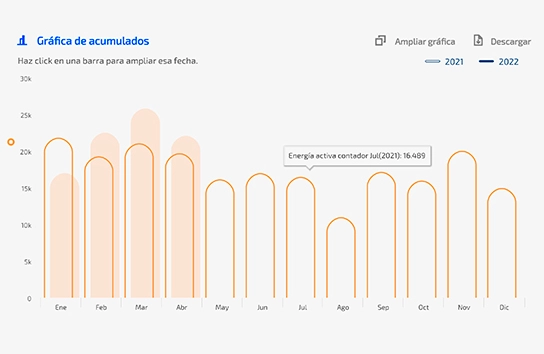
Use OTEA’s API to connect consumption data from your utility meters collected in Datadis, a tool created by the electricity distributors to make it easier to consult information about the electricity contract or consumption. Integrating Datadis into OTEA simplifies the detection of consumption peaks or the activation of time-of-use tariffs by collecting hourly data such as:
DATA COLLECTED EVERY HOUR
- Active energy
- Active power
Create a family and compare
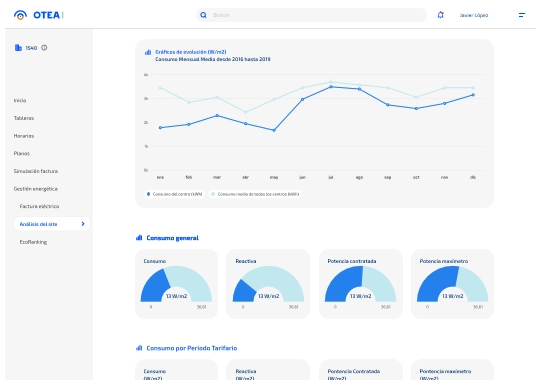
Do you have many facilities and don’t know how to organize them to study their consumption? Create a family of facilities taking into account criteria such as: size in m², geographic location or market, and compare facilities with each other.
TYPES OF ANALYSIS AVAILABLE
- Comparative charts (kWh) against the filtered family average
- Comparative consumption charts (W/m²) by year
- Comparative indicators of overall consumption, average daytime on working days, average during the weekend or average night-time
- Consumption distribution during working days or the weekend
- Ranking position within a family based on energy indicators
Detect anomalies
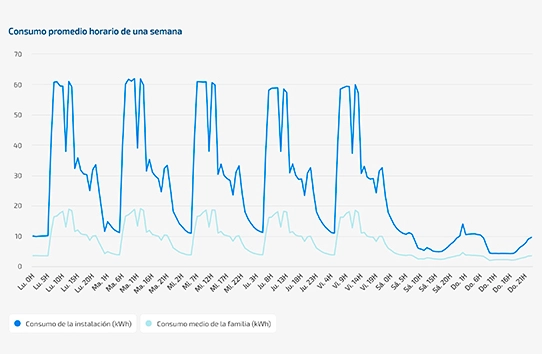
Use OTEA BEn to detect peaks and after-hours consumption to save on the electricity bill and reduce your facilities’ CO₂ emissions. That’s what a client with a network of 720 offices did, using BEn’s ranking and analysis tools to quickly detect the offices that had a high energy cost outside working hours. They discovered that many left the HVAC on at night, on Saturdays and Sundays, when no one was working
Take action and compare again
If you’ve already identified inefficient facilities and time slots with overconsumption in your business, it’s time to take action. With BEn you can analyze the impact of the measures implemented. This way, it’s possible to analyze the ROI of works or other improvements that initially can’t be audited digitally. Discover more about how to centralize the energy and operational management of multi-point facilities by taking a look at our use cases.
OTEA BEn for energy managers
A toolkit to digitalize energy performance
OTEA’s energy comparator features help energy managers save the time they spend manually checking indicators.
Efficiency, savings and security
Efficiency
Quickly detect overconsumption and cut correction time to a minimum. Improve your company’s efficiency.
Savings
Reduce the cost of your electricity bill by launching energy efficiency measures that lower energy consumption.
Security
The data collected and processed in OTEA BEn comply with the strictest cybersecurity standards.
Compare energy consumption data without missing any detail
Data connection
- Electricity meters (two years of data history)
- Electricity bills
Energy indicators
- Energy (kWh)
- Average consumption (W/m²)
- Average consumption by time of day (W/m²)
- Peak power per m² (W/m²)
- Energy cost (€/m²)
Analysis indicators
- Families of facilities
- Comparative charts in kWh
- Comparative charts in (W/m²) by year
- Consumption indicators: overall, average daytime –working days–, weekend.
- Consumption distribution tables by day and hour
Anomaly management
- Early detection of overconsumption
- Performance indicators before and after implementing efficiency actions
Integrations
- Simultaneous integrations with other data analysis programs
Want to see EcoMT’s technology in action?
Talk to us! We’ll help you assess your current challenges and show you how EcoMT’s technology can connect every part of your facility operation.


