
Have a control panel with key energy management indicators
Build real-time energy management dashboards with OTEA, with KPIs that give you an overall view of what’s happening in your business. Visualize the facilities with the highest energy cost (€/m²), set savings targets based on baselines or track consumption projections.
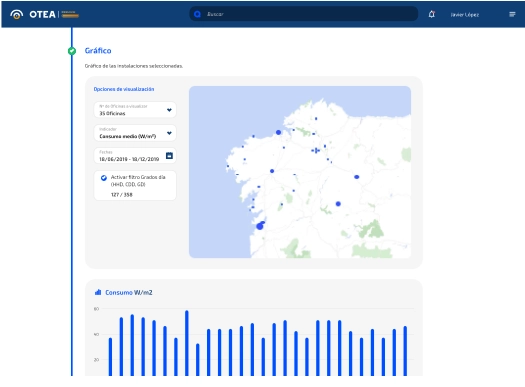
Key indicators, always at hand
Real-time energy performance dashboards to understand what’s happening in your facilities and make decisions with data.

Build confidence
Build stories with your data. Make annual consumption comparisons on your bills, track your energy savings targets or check your consumption projections.

Build by families
Create dashboards for families of facilities. This way, you’ll have indicators for a group of facilities classified by size -area per m²-, location, market or whatever you choose.

Use different energy KPIs
Use indicators such as: energy, peak power per m² or energy cost to create comparative charts, average lines or a top 10 of facilities with the highest or lowest consumption.

Set targets
Set savings targets and use baselines to compare them with the real savings you achieve in your facilities by automating processes or launching energy efficiency actions.
Your dashboards, step by step
Facility management dashboard
Select the family of facilities you want to visualize, set a time interval and choose an indicator to see which facilities have the highest or lowest consumption, analyze their energy performance with average lines or make comparisons by indicator.
TYPE OF INDICATORS AVAILABLE
- Energy (kWh)
- Average power (W/m²)
- Average power during working hours (W/m²)
- Average night-time power (W/m²)
- Peak power per m² (W/m²)
- Average weekend power (W/m²)
- Energy cost (€/m²)
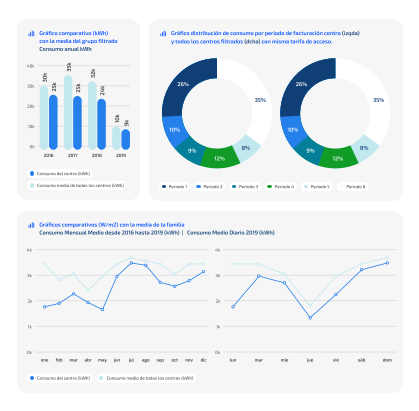
Invoices dashboard
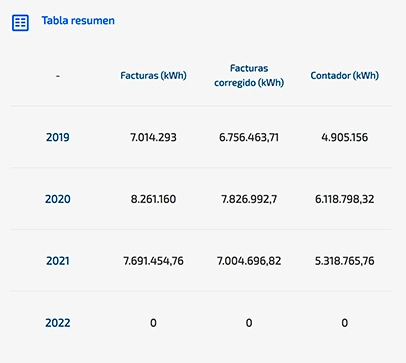
Use different indicators to analyze how your annual billing evolves. You’ll be able to consult summary tables with billing data by year or compare actual billing with adjustments to your bill or with the data collected by your utility meter by integrating OTEA with Datadis. Datadis is a tool created by the electricity distributors to make it easier to consult information about the electricity contract or consumption.
Indicator and macro-historical dashboard
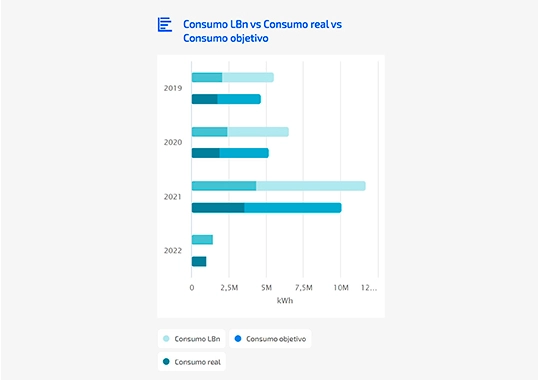
Use the indicator dashboard to compare consumption by kWh/m² or W/m² according to your family of facilities, using baselines (consumption prediction equations), the values you set as targets and actual consumption. You’ll be able to track your savings targets vs actual savings, as well as see a summary table by year. Use the macro-historical dashboard to compare the energy consumption or the % of savings you set as a target with actual energy consumption, and quickly visualize any deviation, positive or negative, from the set targets.
Projection and monthly tracking dashboards
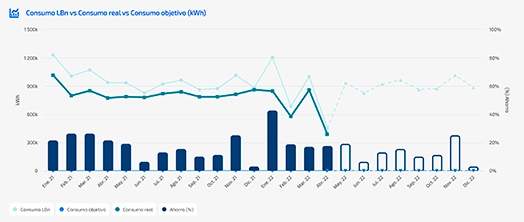
While the projection dashboard lets you see the consumption forecast for the current year for the family of facilities you choose, the monthly tracking dashboard makes it easier to follow the targets set by year. You’ll be able to analyze, simply and intuitively, how accumulated or target savings evolve, as well as actual consumption vs the savings percentage. These dashboards are a real-time information management tool that monitors, analyzes and provides key energy performance indicators of great value to the business.
Dashboards for executives
A tool to track how energy performance evolves
OTEA’s dashboard features give energy managers and executives essential energy indicators by family of facilities.
Performance, flexibility and security
Performance
Check all your savings indicators in real time and get ready for audits by tracking the energy performance of your facilities by family.
Flexibility
If you need it, contact us and we’ll help you implement your dashboard vision without leaving aside modern analytics and the right technology for your business.
Security
Have data governance models that respect the strictest cybersecurity standards, whose administration is simple and effective, making the IT department’s job easier.
Don’t waste time reinventing energy performance dashboards
Dashboards
- Facility management
- Electricity bills
- Consumption projection
- Savings target tracking
Data visualization
- Relevant indicators
- Comparative consumption charts by indicator or time
- Deviation charts against set targets
- Average consumption lines
- Cumulative charts
- Target deviation charts
- Trend lines
- Consumption forecast charts
- Summary tables by indicator or year
What you don’t see
- Calculation models for baselines
- Smart forecasting models
- Automatic value adjustment for electricity bills
Want to see EcoMT’s technology in action?
Talk to us! We’ll help you assess your current challenges and show you how EcoMT’s technology can connect every part of your facility operation.


